Running a data-driven services organization

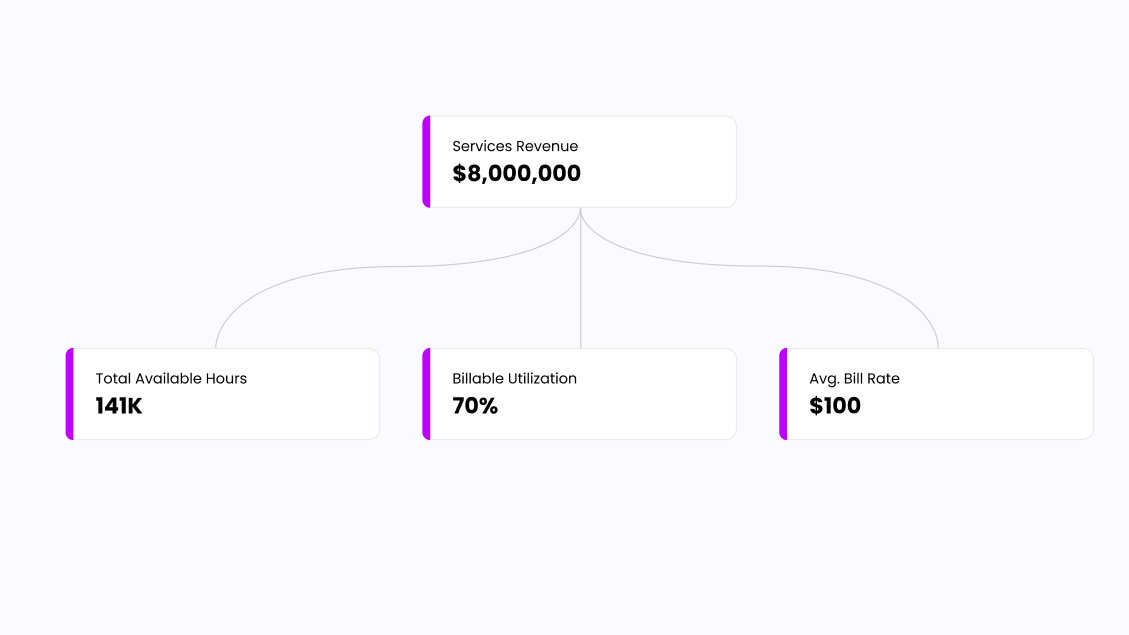
At Koalitix, services are one of our main revenue drivers. As any growing company that provides services, we use data to drive our organization to success. In this blog post we’ll outline the primary metrics that we believe can be used by any services organization to become more data-driven.

Becoming a data-driven organization starts with deciding which metric you want your organization to optimize for. A services organization has several choices. Most organizations with a profit focus try to optimize for gross margin to find the best balance between their costs of services and their services revenue. However, most growth focused services organizations try to optimize revenue growth.
For this blog post, we’ll focus on optimizing for revenue growth.
Timewriting as a prerequisite for data-driven decision-making
Most services organizations bill their customers by the hour (time & material engagements), and therefore need to keep track of the time their consultants spend on customer work.
Another model that is often used is that services are sold at a fixed price per project (fixed price engagements). It is possible to avoid timewriting when using this model. That being said, if a services organization does not track the time they spend per customer project, they have no insight into their core product (their consultant’s time). They do not know how much of their core product they sell or what it costs to ‘produce’ their core product.
To lay a comparison: It would be the equivalent of a bookstore selling books by the box, but not counting how many books they put in each box.
For this reason, almost all services organizations have timewriting or introduce timewriting as they scale.
This leads us to the core driver of revenue in a services organization, which is:
Total Available Hours x Billable Utilization x Avg. Bill Rate

The balance between drivers
Whenever a services organization is struggling to meet revenue targets, it’s most likely caused by one of the three drivers mentioned above:
Bill Rate: The amount charged per hour spent on customer projects is too low.
Utilization: Too much consultant time is being spent on non-billable activities.
Not enough resources: The organization is behind on its hiring plans, and therefore does not have the total available hours required to hit their revenue number.
Sometimes it is possible to offset an issue with one driver by overperforming with another. However, there is a limit. Many services organization focus on optimizing utilization, as it is the main metric they control, but you can only optimize so much.
To provide an example: Imagine a one-person consultancy with the goal of reaching 150K in revenue in one year.
Assuming this consultant takes no holidays in their first year and works 8 hours per day, the total number of available hours in the year is: 2,024 hours.
If this consultant charges $50 an hour, they would need a utilization of 148% to reach their revenue target. Clearly a bill rate of $50 is too low to be able to hit the target that has been set for the year.

Similarly, if the consultant is only able to spend 30% of their time on billable customer work and spends the remainder of their time on non-billable activities such as sales, self development, internal projects, or other activities, they would need to 5x the $50 rate to $250 to make their target by the end of the year.

As you can see there is a careful balance between the three drivers for services organizations. They have a direct influence on one another.
Getting more insight into utilization
The driver of billable utilization is relatively straightforward. Take 100% of a consultant’s time and subtract the time spent on other activities.

Be careful when deciding what time buckets to track. Too many activity buckets can become an administrative burden. It also decreases the quality of your data, because consultants can not keep track of all the different buckets they are required to write time to. On the other hand, too little activity buckets leads to too little or no actionable insight.
Our advice: Start with a small amount of actionable activity buckets. Allow this to slowly evolve over time. With the emphasis on slow evolution. Changing your activity buckets too often will also lead to bad quality data and make it difficult to compare data over time.
Each activity needs to be actionable. Does an activity not provide any actionable insight? Remove it.
Actionable data can be used as input for new initiatives
You might be wondering, what is actionable? Often larger buckets that will never be completely removed, but should be minimized are actionable. For example: Tracking time spent on sales engagement.
Imagine 5% of consultant time is being spent on sales related activities. After investigating why this is so high, you find that a majority of services related sales activities is being spent on scoping that’s required to be able to provide a Statement of Work (SOW) to a prospect.
5% of 2,024 hours per year is 101 hours per consultant per year. If you have a 10 person services organization, that’s 1000+ hours per year!
More than enough reason to start a few initiatives for improving the scoping process, such as:
- Creating scope templates or calculators that sales can use without the involvement of services for early stage sales opportunities
- Changing when scoping happens, maybe to a later stage in the sales process (to remove time spent on unused scopes for early stage opportunities that have a higher chance of being lost)
In the end, the buckets an organization chooses are unique to the organization. But a few common buckets are:
- Administrative work
- Internal projects
- Bench time
- Customer project preparation
- Non-billable customer work
Creating a driver tree for your organization
The examples above are a great start for creating a model that fits your organization. Most services models that optimize for revenue growth will have the same base driver using Total Available Time, Bill Rate, and Utilization. However the driving metrics of utilization can differ quite a bit per organization. There will also be additional complexities when it comes to creating a model that works across several regions / teams and other organization specific factors.
Let us help you
At Koalitix we have expertise with a wide variety of services planning and metric models and have created specialized tooling to help create & track to strategic plans like the one above.
We provide software and services for strategic executions. We use Driver Trees and other methodologies to help companies make the right choices and use data to derive actions. Reach out if you’re interested in learning more about this or would like to try out our software.