Creating a data-driven B2B sales plan

It’s that time of the year again: the planning cycle has kicked off and everyone is creating their plans for next year. There’s an ambitious new revenue number that needs to be hit, but how? How many opportunities are needed? How many leads do we need to generate? In this blog post we’ll show you a simple way of creating a data-driven sales plan, using Driver Trees.

Let’s paint a hypothetical: A scaling organization has done 5M in sales in the past year. The new target for this year is 7M. That’s an ambitious 40% year on year growth. What’s the plan to get there?
By using a Driver Tree we’re going to create a data-driven plan that will help us get to this number.
The Sales Driver Tree

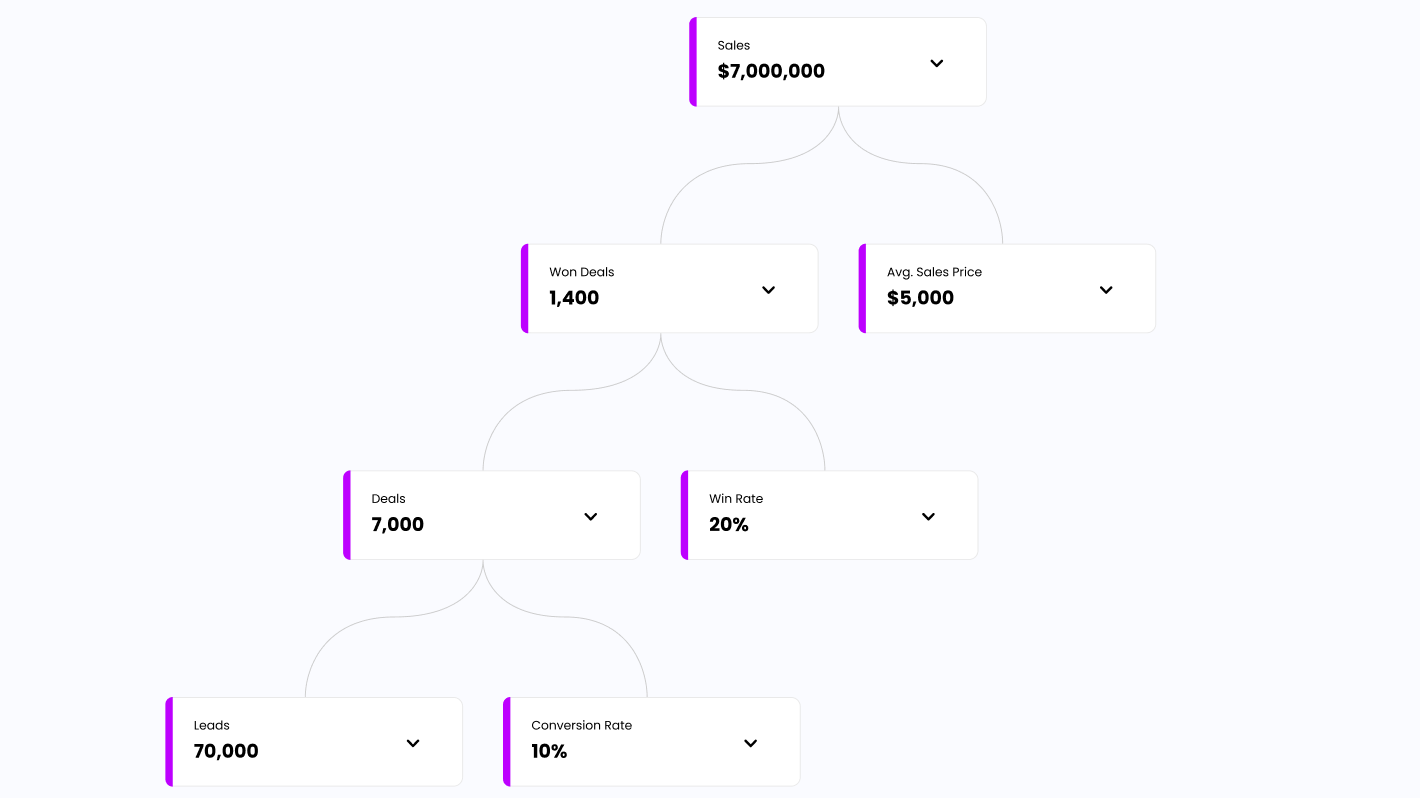
Most B2B sales Driver Trees will look like this in some way or form. The metric names will most likely be a little different per organization. Some organizations also add additional steps for key moments in their business process (e.g. the handoff of an opportunity betweeen a sales development rep to an account executive). But the overall structure will most likely be the same for most B2B sales organizations:
1. Leads x Conversion Rate = Deals
Leads are generated and converted to Deals.
2. Deals x Win Rate = Won deals
Deals are won, which leads to the # of won deals.
3. Won Deals x Avg. Price = Sales
Won deals are sold at an average price, which leads to your sales number.
Setting your targets
Using this simple model we can start creating a plan to get to the 7M sales target. We’ll start by plugging in our sales target. But which numbers do we retrieve next?

It’s often best to look at historical data for the numbers that you have the least influence on. These are often your multipliers:
- Avg. Price
- Win Rate
- Conversion Rate
In our case, the company had an Avg. Price of 5K, a win rate of 20%, and a conversion rate of 10% in the past year.

The final step to creating a first draft of our plan is by using the drivers of the Driver Tree to calculate the missing metrics.
Sales / Avg. Price = Won Deals
This means to achieve a 7M sales target, we will need 7,000,000 / 5,000 = 1,400 won deals.
Won Deals / Win rate = Deals
This means to achieve 1,400 won deals, we will need 1,400 / 0.2 = 7,000 deals.
Deals / Conversion Rate = Leads
This means to achieve 7,000 deals, we will need 7,000 / 0.1 = 70,000 leads.

Aligning the plan
Great, we have our base set of targets. But now we need to ensure that our sales plan aligns with others in the organization. We are not sure if marketing can deliver 70,000 leads.
After some back and forth with marketing we find out that marketing can only deliver 64,000 leads. What does this mean for our sales plan?

If we only get 64,000 leads we’ll end up short on our deals, won deals, and eventually revenue number. So how are we going to compensate?
Making strategic bets driven by data
This plan is great input for what strategic initiatives we should run this year to ensure we reach our revenue number. We have 3 drivers that we can improve:
- Improve Conversion Rate
- Improve Win Rate
- Improve Avg. Price
We can try and improve all 3 equally.
For example, we could introduce these new initiatives:
Improve Lead Conversion Rate from 10% to 10.4%:
Invest in SDR cadences and training to improve the Lead Conversion Rate
Improve Deal Win Rate from 20% to 20.8%:
Invest in a new sales collateral & presales training to improve the deal win rate
Increase Avg. Price from 5,000 to 5,050:
Introduce a new price list increase of 1-2% to increase the Avg. Price

A simple data driven sales plan
With this Driver Tree we’ve created a simple data-driven sales plan that outlines how we are going to hit this year’s new revenue number. We have set coherent targets from the start of our sales funnel to the end, based on historical data. We have ensured that it has been aligned with the parties that are responsible for key driving metrics at the bottom of our tree. We have planned strategic initiatives that will lead to improvements that will help us get where we need to be.
Real world complexities
The above example is a great start if this is your first time creating a sales plan. However, in real world examples you will encounter several complexities that will make your plan much more complex. To name a few:
- Creating a plan that spans across several regions / teams, each with different historical performance
- Creating a plan with deals sourced from different sources (e.g. Marketing Sourced vs. Sales Sourced), each with it’s own performance and sometimes also different drivers
- Taking time to convert into account: some deals that were generated in previous years could still convert this year, as will some deals that were generated this year not convert until next year
Let us help you
At Koalitix we have expertise with a wide variety of sales planning models and have created specialzied tooling to help create & track to strategic plans like the one above.
We provide software and services for strategic execution. We use Driver Trees and other methodologies to help companies make the rights choices and use data to derive actions. Reach out if you're interested in learning more about this or would like to try out our software.