What is a Driver Tree and why should you be using them

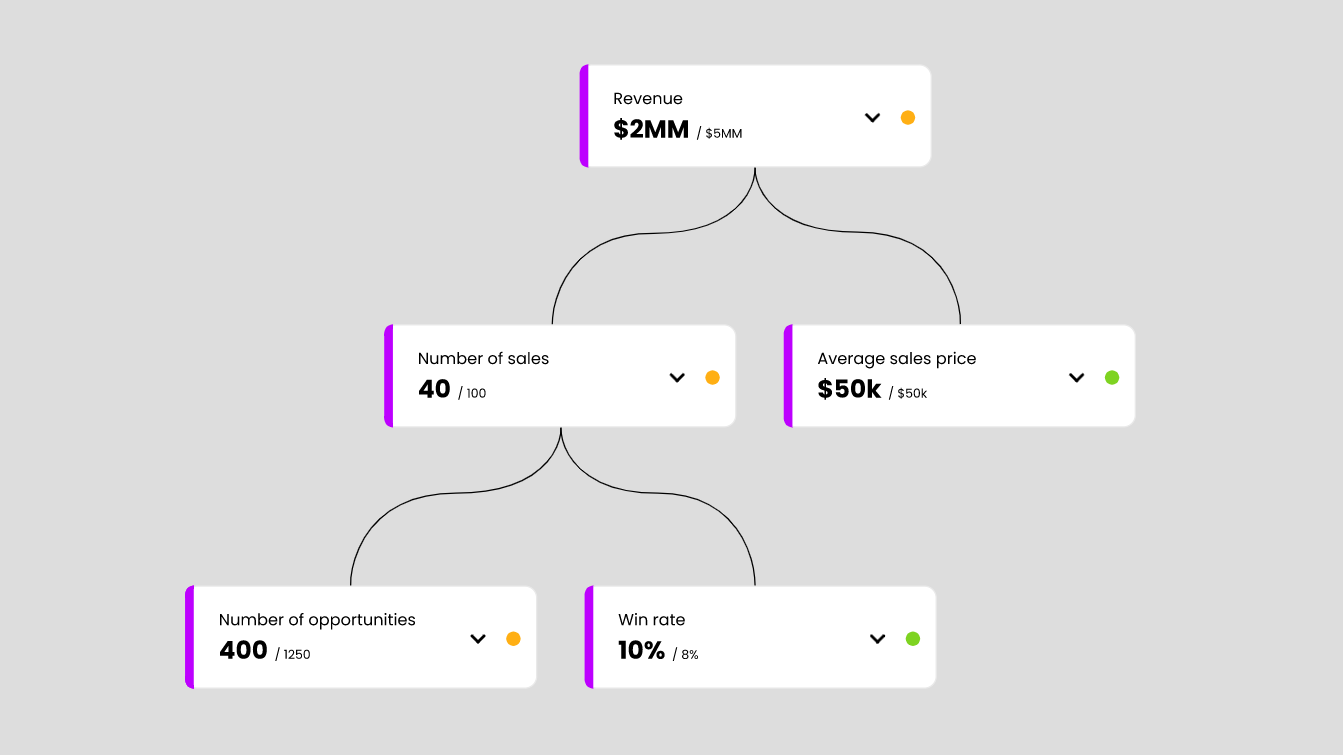
Using data to create actionable insights is difficult. When you have so many reports and metrics being tracked, it is increasingly rare that you are able to make inferences between them to drive actions that lead to value. Driver Trees can help you make better use of your data. They are a strategic tool that allow you to identify actionable insights, so that you can act on opportunities and solve bottlenecks proactively.

Driver Trees identify metrics that drive business results
Driver Trees are an overview of an organization’s core metrics that drive an overarching goal. They map out all the influencers of your main goal, that you can also see as levers, that drive results. In essence they consist of two parts:
- Metrics: These are the leaves or nodes in your tree. They are measurable and can be calculated with the raw data that you extract from your systems and applications.
- Drivers: This is the logic that explains the relationship between your metrics in your Driver Tree. These can either be logical drivers (1+1 = 2), or indirect influencing drivers (positive / negative).
Creating a Driver Tree requires a good understanding of your business’s core processes. But once you have one that is complete, they can be immensely valuable.
An example of an online bookstore
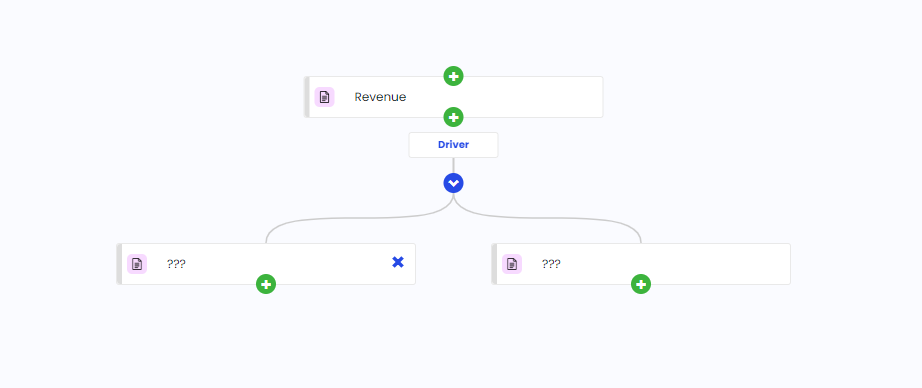
To help illustrate how a Driver Tree works, we’ll take the example of a simple online book store. The book store has a website with some Google Ad campaigns to funnel traffic to their website. To make ends meet, they need to ensure that they make $1,000 by the end of the year. This means their top level goal is Revenue. But what other metrics should they track?
Let’s do some online research on what the most important metrics are for an online webshop. I found this blog post which describes some core metrics that an online webshop should track:
- Website Traffic
- Conversion Rate
- Average order value
- Customer lifetime value
- Exit rate
- Return rate
- Newsletter performance
The problem with tracking these metrics is that it is not immediately clear how they can be used to drive action. For example, let’s say we start tracking Conversion Rate for the online bookstore. The Conversion Rate is 4%. Is this good or bad? According to this article, the industry average is 2.31%, however, the best in the industry are converting at 5.31% or higher. So it looks like it’s good enough for now. But what if it declines to 3.5% or 3%. When is it bad enough that the online bookstore should take action to try and improve it?
Let’s try to find out…
A simple Driver Tree for selling books
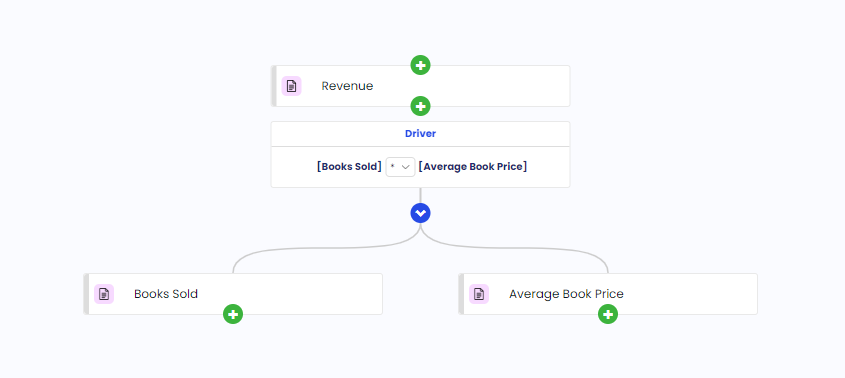
The bookstore’s top level goal for the year is to make $1,000 in Revenue. To create our Driver Tree for this, we need to figure out what drives Revenue. For the bookstore, the only revenue driver is book sales. On average the bookstore sells books for $10 each. So, to be able to earn $1,000 it needs to sell $1,000 / $10 = 100 books. In this case, we can see that Revenue is driven by 2 metrics:
- Books Sold
- Average Book Price
The Driver of Revenue therefore becomes: Books Sold * Average Book Price ($)
Which makes the initial Driver Tree look like this:
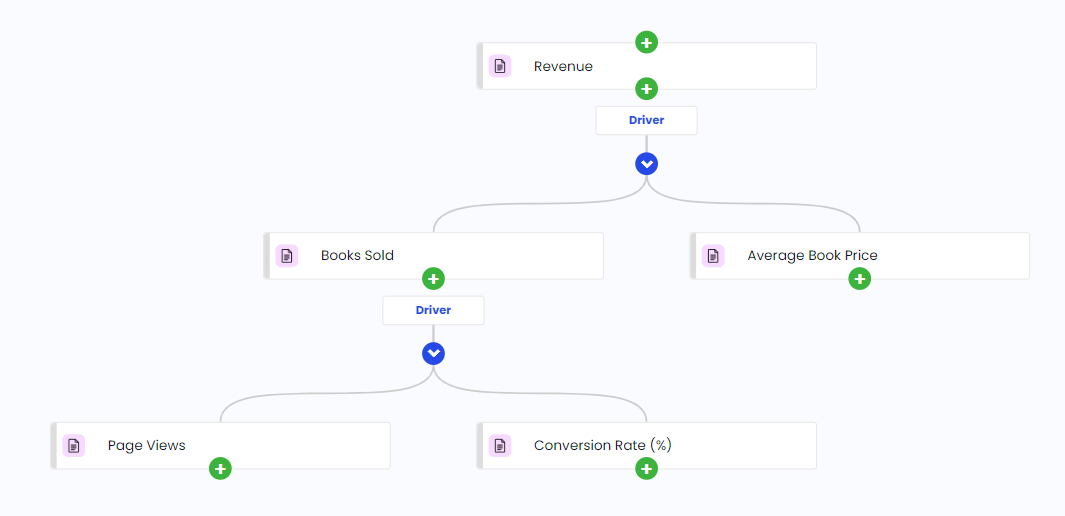
We can continue building the Driver Tree downwards. What drives books sold? For the online book store, that would be people viewing a book page and buying the book (converting). There are two new metrics for this:
- Page Views
- Conversion Rate (%)
If the bookstore needs to sell 100 books to reach $1,000 in Revenue and it has a conversion rate of 4%, then it needs:
100 / 4% = 2500 page views on it’s book pages. The Driver Tree for the bookstore now looks like this:
Finally, what drives page views? The bookstore is using Google Ad campaigns to attract people to their website. So the main driver for page views is the number of people that viewed Ads and the percentage of people that actually click on the ad to come onto their website. This is called a Click Through Rate (CTR). This means we have two new metrics that drive page views:
- Google Ad Views
- Click Through Rate (%)
This makes the full Driver Tree for the bookstore look like this:
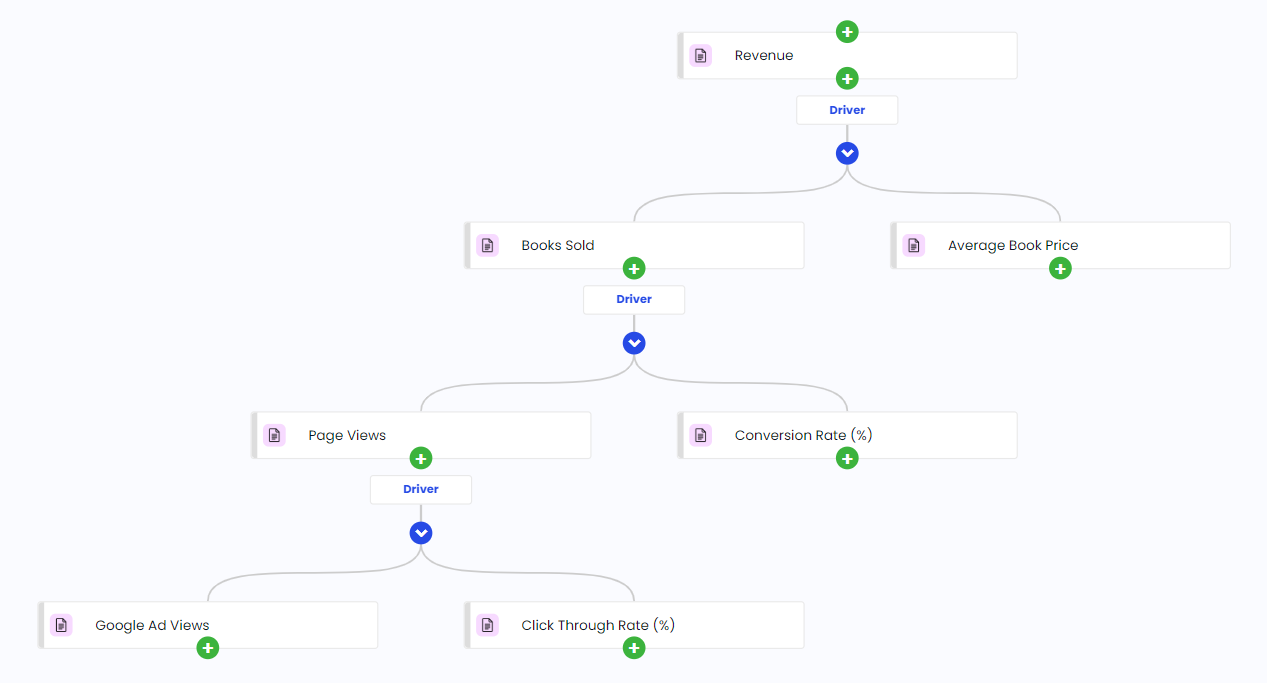
Note: for this example, we've kept this Driver Tree relatively simple. In actual use cases you'll want to have a close to complete view for each driver. For example: a web shop will have other sources for their page views (e.g. organic channels) besides their Google Ad sourced views. But we've excluded that for this example.
The value of the Driver Tree
Going back to our initial question: At what point should the bookstore intervene when their conversion rate drops? Using the Driver Tree we can figure this out. Assume that the bookstore is halfway through the year. We see that the conversion rate has dropped to 3.5%. So far the book store has achieved the following results:
- Google Ad Views: 25,000
- Click Through Rate: 5%
- Page Views: 1,250
- Conversion Rate: 3.5%
- Books Sold: 44
- Average Book Price: $10
- Revenue: $440
If things were to continue for the second half of the year as they are the bookstore would end up with a $880 result. The conversion rate of 3.5% is too low to make the overarching goal.
So what conversion rate does the bookstore need to make it to $1,000 by the end of the year? The bookstore needs $1,000 – $440 = $560 more revenue by the end of the year. Let’s use the Drivers from the Driver Tree to figure out a plan of attack.
Driver 1: Books Sold * Average Book Price ($) = Revenue ($)
This means the bookstore needs to sell $560 / $10 = 56 more books.
Driver 2: Page Views * Conversion Rate (%) = Books Sold
Assuming it gets the same number of page views, like we did in the first half of the year, it would need a conversion rate of 56 / 1,250 = 4,5%.
This seems tricky to achieve. The bookstore could maybe get the conversion rate back to 4%. This means that it’ll be able to get 1,250 * 4% = 50 books sold. This leads to 50 * $10 = $500 in additional Revenue by the end of the year. That leaves us with a remaining $60 that the bookstore needs to get through other means.
What other options do we have? Let’s look at the third driver we created earlier:
Driver 3: Google Ad Views * Click Through Rate (%) = Page Views
The bookstore could also bump the Google Ad campaign spending to get more page views. As we saw previously, to get the additional $560 in Revenue by the end of the year it needs to sell $560 / $10 = 56 books. To get to the 56 books sold with the new target 4% conversion rate the bookstore will need 56 / 4% = 1,400 page views. To get these page views the bookstore will need 1,400 / 5% = 28,000 ad views.
Using the Driver Tree we have found that if the bookstore were to take the following actions:
- Improve Conversion Rate from 3.5% to 4%.
- Bump ad spending so to generate 28,000 instead of 25,000 ad views (12% increase).
It should be able to make it to $1,000 by the end of the year.
Note: In a real life example, increasing things like ad spending also increases costs, which isn't always an option without also increasing revenue. However, for the sake of the example, we've kept this situation simple. In actual use cases this must also be considered and be a part of your Driver Tree.
Driver Trees save you time and lead to better results
As you can see, with the 7 metrics from the Driver Tree we are already able to get to actionable insights. Driver Trees are a tool to use for business reviews. They remove the necessity to review all your KPIs in a standardized cadence, which saves time. Instead they give you a strategic tool to assess the current situation of a business result, forecast what the future situation will be, and create scenarios of what the impact could be of different actions. All of which gives you the power to use data to derive actions that lead to better results.
Interested to learn more?
At Koalitix we provide software and services for strategic execution. We use Driver Trees and other methodologies to help companies make the rights choices and use data to derive actions. Reach out if you're interested in learning more about this or would like to try out our software.